Filters:
Bar Plot
Heat Plot
Cnet Plot
Upset Plot
Table
Single Nucleotide Variations
The Mutation Annotation Format (maf) file contained somatic mutations of all patients in the TCGA LUAD project, was downloaded using TCGAbiolinks package
In the category of SNV analysis, 4 types of plots is available; Onco Plot, Lollipop Plot, Pyramid Plot and Enrichment plots (Bar plot, Heat plot, Cnet plot and Upset plot)
- Please select Plot option first.
- You can select 'Mutation type' to see Sominaclust filtered outputs.
Filters:
Bar Plot
Heat Plot
Cnet Plot
Upset Plot
Table
Copy Number Variations
The CNV dataset for primary solid tumor samples, generated by Affymetrix Genome-Wide Human SNP Array 6.0 platform, was downloaded using TCGAbiolinks package. The significant aberrant genomic regions were identified by R/Bioconductor GAIA package. NCBI IDs and Hugo Symbols of the genes with differential copy number were determined using biomaRt package.
In the category of CNV analysis, 3 types of plots is available; CNV Plot, Onco Print and Enrichment plots (Bar plot, Heat plot, Cnet plot and Upset plot)
- Please select Plot option first.
Filters:
Bar Plot
Heat Plot
Cnet Plot
Upset Plot
Table
Transcriptome Analysis
The Transcriptome Profiling data in mRNA expression level (as unnormalized HTSeq raw counts), generated by TCGA RNA-seq pipeline was downloaded by TCGABiolinks package. Differentially expressed genes were determined with adjusted p-values (q-values) in tumor samples (TP) according to normal samples (NT) by the limma-voom method using limma and edgeR R/Bioconductor packages. NCBI IDs and Hugo Symbols of the differentially expressed genes determined by the biomaRt package.
In the category of CNV analysis, 3 types of plots is available; Volcano Plot, Violin Plot and Enrichment plots (Bar plot, Heat plot, Cnet plot and Upset plot)
- Please select Plot option first.
Filters:
Single Nucleotide Variations Analysis
Draw the Oncoplot,Oncoprint,Lollipop, Pyramid,Survival plots of the somatic mutations of the patient cohorts and genes computed by SominaClust package and TCGA mutect2 pipeline
Copy Number Variations Analysis
Draw the OncoPrint, Survival and Bar graphs of the copy number aberrations of the cohorts and genes computed by GAIA package
Transcriptome Analysis
Draw the Volcano,Violin, HeatMap, Survival plots of the differentially expressed genes of the cohorts compared to adjacent normal tissue using limma-voom linear mixed model
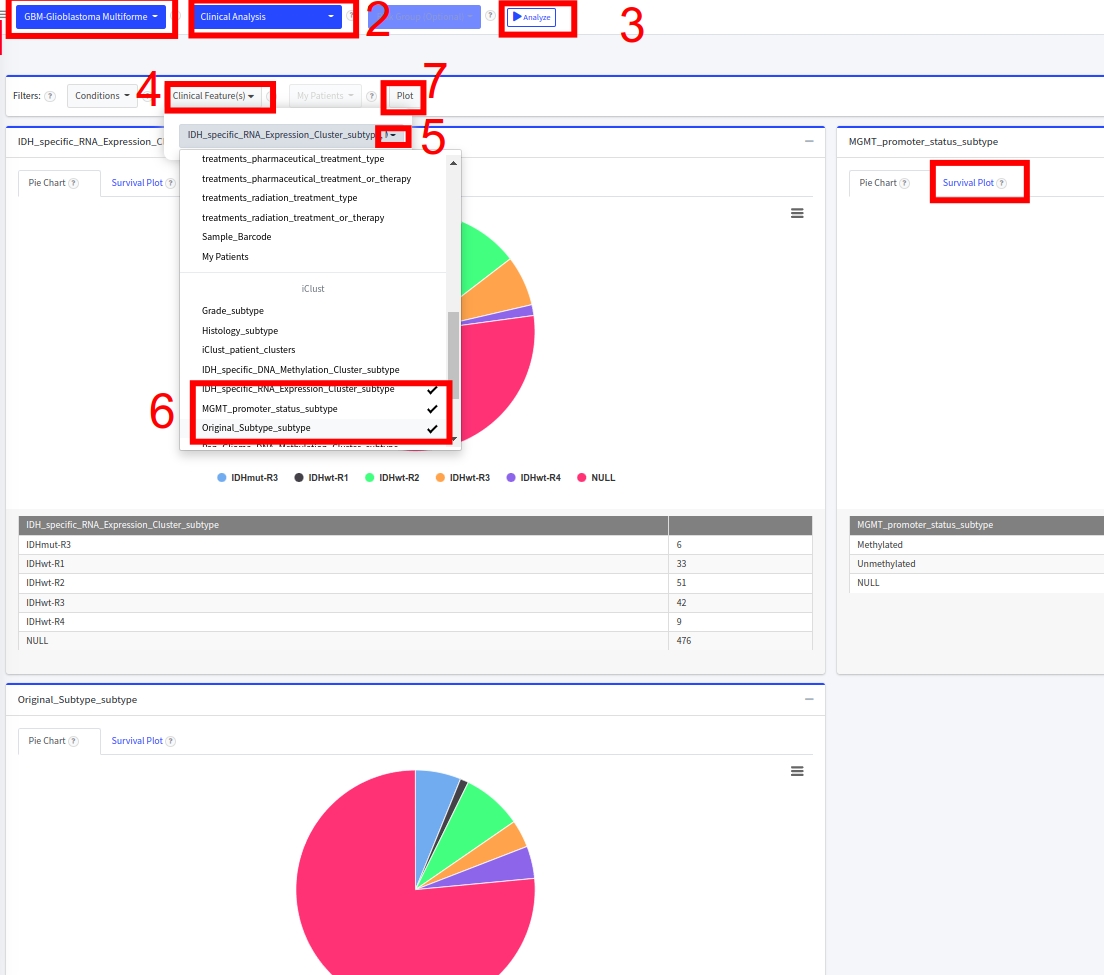
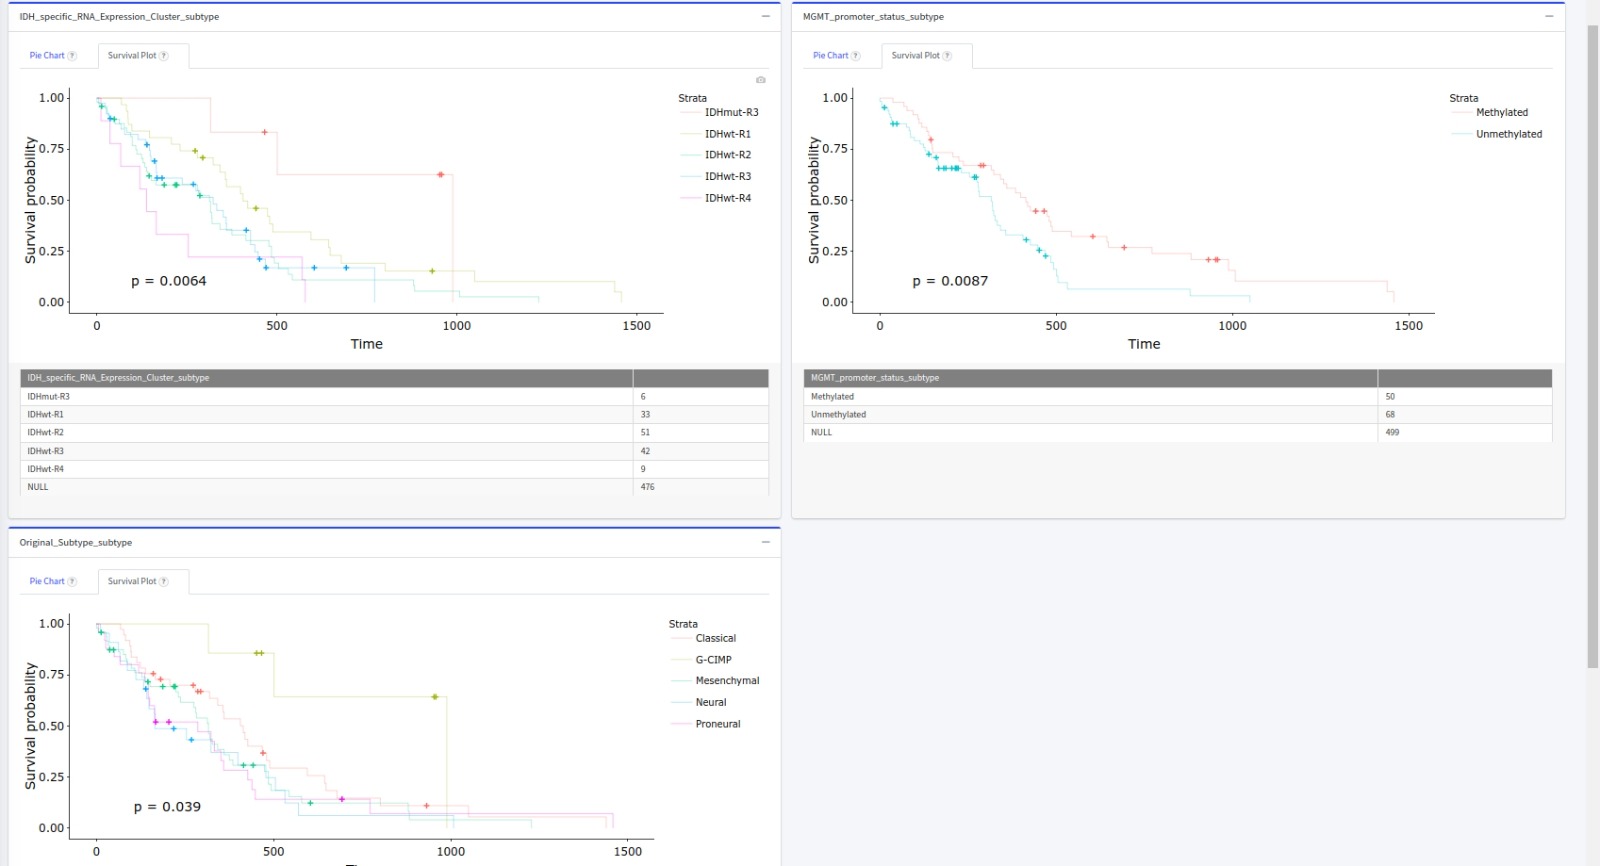
Clinical Analysis
Draw the survival analysis plots and pie-charts for any of the clinical subset of 123 pre-computed cohorts (MSI-H, Immune, PAM50, IDH1,Triple Negative etc).
LAML-Acute Myeloid Leukemia
ACC-Adrenocortical Carcinoma
BLCA-Bladder Urothelial Carcinoma
LGG-Brain Lower Grade Glioma
BRCA-Breast Invasive Carcinoma
CESC-Cervical Squamous Cell Carcinoma and Endocervical Adenocarcinoma
CHOL-Cholangiocarcinoma
COAD-Colon Adenocarcinoma
ESCA-Esophageal Carcinoma
GBM-Glioblastoma Multiforme
HNSC-Head and Neck Squamous Cell Carcinoma
KICH-Kidney Chromophobe
KIRC-Kidney Renal Clear Cell Carcinoma
KIRP-Kidney Renal Papillary Cell Carcinoma
LIHC-Liver Hepatocellular Carcinoma
LUAD-Lung Adenocarcinoma
LUSC-Lung Squamous Cell Carcinoma
DLBC-Lymphoid Neoplasm Diffuse Large B-cell Lymphoma
MESO-Mesothelioma
OV-Ovarian Serous Cystadenocarcinoma
PAAD-Pancreatic Adenocarcinoma
PCPG-Pheochromocytoma and Paraganglioma
PRAD-Prostate Adenocarcinoma
READ-Rectum Adenocarcinoma
SARC-Sarcoma
SKCM-Skin Cutaneous Melanoma
STAD-Stomach Adenocarcinoma
TGCT-Testicular Germ Cell Tumors
THYM-Thymoma
THCA-Thyroid Carcinoma
UCS-Uterine Carcinosarcoma
UCEC-Uterine Corpus Endometrial Carcinoma
UVM-Uveal Melanoma
TCGAnalyzeR
TCGAnalyzeR enables an integrated analysis of 123 pre-computed pan-cancer cohorts (MSI-H, Immune, PAM50,Triple Negative, IDH1 etc) based on the single-nucleotide variations (SNVs), the copy number variations (CNVs), RNA-seq and clinical data. All plots and data tables are interactive and downloadable. Each plot has its filtration options. The user can click and add a gene or patient to the “My genes” or “My patients” panel. Team members are:

Tuğba ÖNAL-SÜZEK

Talip ZENGİN

Başak ABAK MASUD
FAQ


- First, select GBM cancer type and Single Nucleotide Variation Analysis from the topmost pull-down menus.
- From Filters, change number of top genes to 5
- From Filters, add IDH1 gene by typing the gene name and thenclicking the gene name
- From Filters, un-select the iClust_patient_clusters and select Original_subtype_subtype and IDH_specific_RNA_Expression_Cluster_subtype
- Click on Plot button
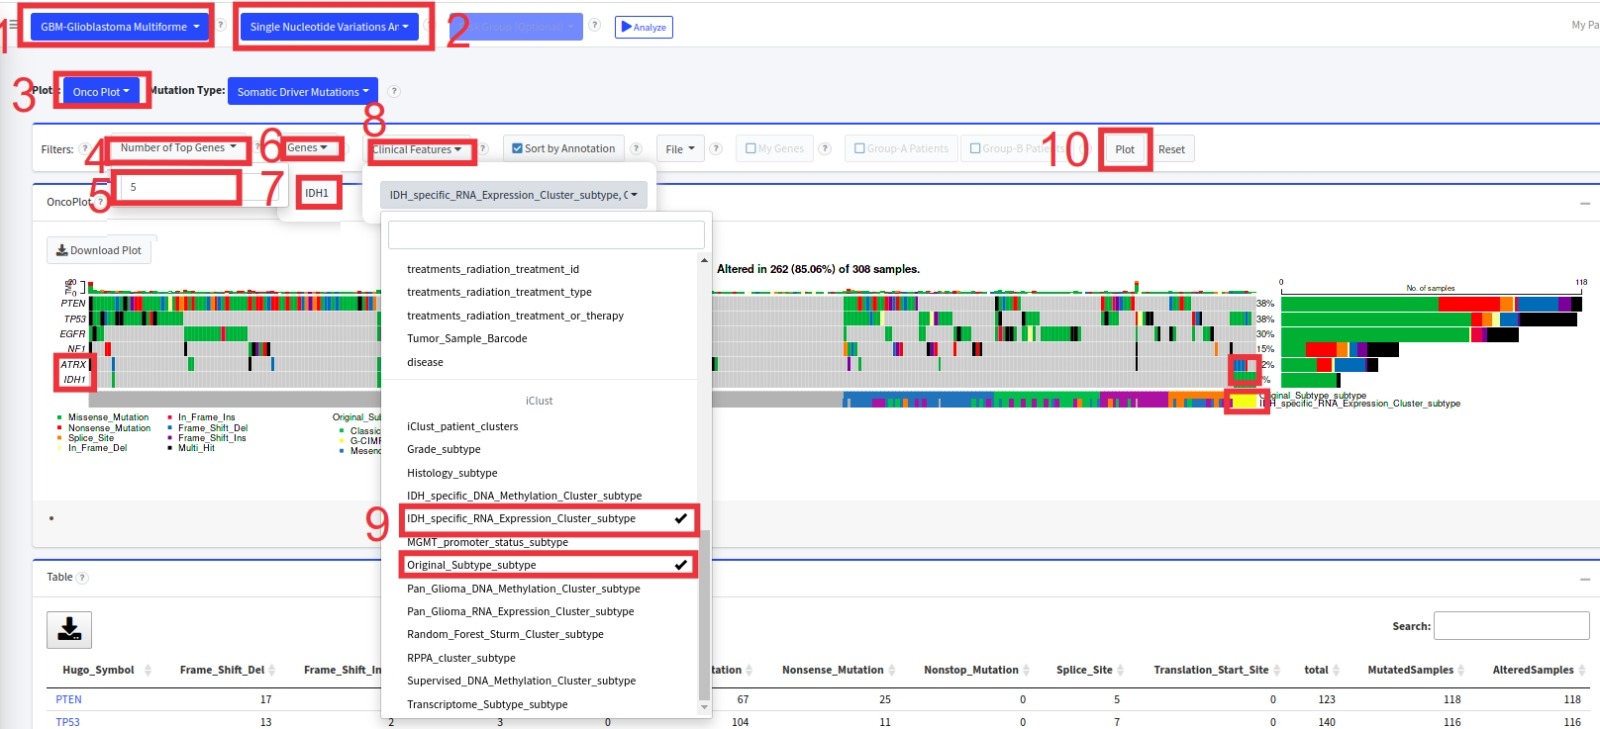
- And see the K-M survival p-values for each of these 3 subcohorts
- TCGAnalyzeR offers Iclust_patient_clusters for retrieval under license terms that generally allow for more liberal redistribution and reuse than a traditional copyrighted work (e.g., Creative Commons licenses) Please contact tugbasuzek@mu.edu.tr for systemic download requests.